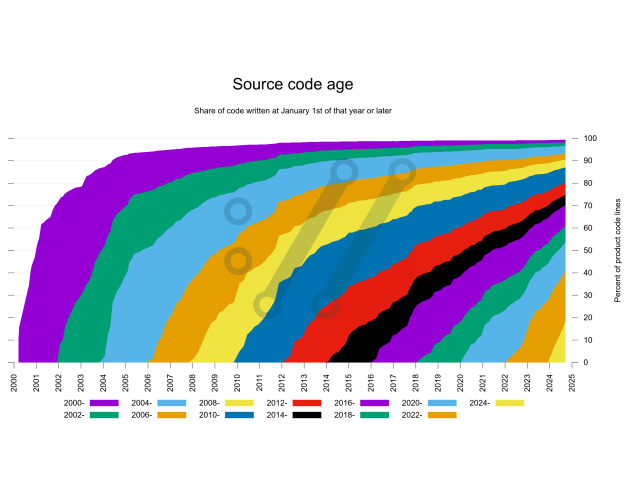
daniel:// stenberg:// 1 year ago • • daniel:// stenberg:// 1 year ago • • #curl source code age (take 2)How large share of the code was written after a certain date, over time. #curl Languages Search Text Share via ...
in reply to daniel:// stenberg:// Étienne Parmentier in reply to daniel:// stenberg:// • 1 year ago • • how is it possible that the graph doesn’t add up to 100% ? Has it been modified ? Is some period missing ? Languages Search Text Share via ...
in reply to Étienne Parmentier daniel:// stenberg:// in reply to Étienne Parmentier • 1 year ago • • those are the few lines we committed before 2000-01-01 This entry was edited (1 year ago) Languages Search Text Share via ...
in reply to daniel:// stenberg:// daniel:// stenberg:// in reply to daniel:// stenberg:// • 1 year ago • • legend on the left makes better use of vertical resolution Languages Search Text Share via ...
in reply to daniel:// stenberg:// 𝚜𝚎𝚕𝚎𝚊 in reply to daniel:// stenberg:// • 1 year ago • • oh what do you use to visualize this? Languages Search Text Share via ...
in reply to 𝚜𝚎𝚕𝚎𝚊 daniel:// stenberg:// in reply to 𝚜𝚎𝚕𝚎𝚊 • 1 year ago • • @selea perl script running git blame a bazillion times, then gnuplot to render the graph @𝚜𝚎𝚕𝚎𝚊 Languages Search Text Share via ...
in reply to daniel:// stenberg:// CgX in reply to daniel:// stenberg:// • 1 year ago • • Is it possible to see the amount of code in absolute terms and not as a percentage? :)#weirdRequests #weirdrequests Languages Search Text Share via ...
in reply to CgX daniel:// stenberg:// in reply to CgX • 1 year ago • • @cgx that would make the first like 10 years barely visible as the code growth has been significant @CgX Languages Search Text Share via ...
in reply to daniel:// stenberg:// CgX in reply to daniel:// stenberg:// • 1 year ago • • Wow ok... unless with a logarithmic scale, that will be not pretty Languages Search Text Share via ...
in reply to CgX daniel:// stenberg:// in reply to CgX • 1 year ago • • @cgx yeah, and log scales are tricky beasts to read @CgX Languages Search Text Share via ...
in reply to daniel:// stenberg:// CgX in reply to daniel:// stenberg:// • 1 year ago • • Right ! At least I try Languages Search Text Share via ...
in reply to daniel:// stenberg:// Stephen Shankland in reply to daniel:// stenberg:// • 1 year ago • • That's fascinating. Are all projects so evenly fresh? And what's it look like in LOC vs time vs the % shown here? Languages Search Text Share via ...
in reply to Stephen Shankland daniel:// stenberg:// in reply to Stephen Shankland • 1 year ago • • lines of code have exploded over the decades: This entry was edited (1 year ago) Languages Search Text Share via ...
in reply to daniel:// stenberg:// Stephen Shankland in reply to daniel:// stenberg:// • 1 year ago • • thanks. Pretty linear. Interesting. Languages Search Text Share via ...
in reply to Stephen Shankland daniel:// stenberg:// in reply to Stephen Shankland • 1 year ago • • @stshank it's actually quite fascinating I think and it will be curious to see for how long it can continue., I mean logically it needs to plateau at some point! @Stephen Shankland Languages Search Text Share via ...
in reply to Stephen Shankland daniel:// stenberg:// in reply to Stephen Shankland • 1 year ago • • @stshank I don't know how this compares to other projects @Stephen Shankland Languages Search Text Share via ...
in reply to daniel:// stenberg:// daniel:// stenberg:// in reply to daniel:// stenberg:// • 1 year ago • • My scripts for this are of course available and open source and you can run them against your project easily.Just needs perl, git, gnuplot - and patience.github.com/curl/stats/blob/mas…github.com/curl/stats/blob/mas…stats/codeage.pl at master · curl/statsScripts for generating project statistics and for plotting them as graphs. - curl/statsGitHub Languages Search Text Share via ...
in reply to daniel:// stenberg:// Quentin Pradet in reply to daniel:// stenberg:// • 1 year ago • • I like how this paints a very different picture than the percentile graph earlier. Languages Search Text Share via ...
in reply to daniel:// stenberg:// bkim in reply to daniel:// stenberg:// • 1 year ago • • Rich Hickey has used a similar tool to measure the Clojure and Scala codebase stability for his HOPL article, let me find it Languages Search Text Share via ...
in reply to bkim bkim in reply to bkim • 1 year ago • • it's called Hercules: github.com/src-d/hercules GitHub - src-d/hercules: Gaining advanced insights from Git repository history.Gaining advanced insights from Git repository history. - src-d/herculesGitHub Languages Search Text Share via ...
in reply to bkim daniel:// stenberg:// in reply to bkim • 1 year ago • • @bkim ah yes, I've seen those graphs. They show absolute numbers of lines of code better. @bkim Languages Search Text Share via ...
Unknown parent daniel:// stenberg:// Unknown parent • 1 year ago • • @christianrickert @bkim you mean the file header comments? 😁 @bkim @Christian Rickert Languages Search Text Share via ...
Unknown parent daniel:// stenberg:// Unknown parent • 1 year ago • • @kurtseifried yes I'm working on such a version as well @kurtseifried Languages Search Text Share via ...
in reply to daniel:// stenberg:// Daniel Vergien in reply to daniel:// stenberg:// • 1 year ago • • Cool chart! The 100% are code base today? Does it mean curl is not growing significantly since around 2005? What happened there? Languages Search Text Share via ...
in reply to Daniel Vergien daniel:// stenberg:// in reply to Daniel Vergien • 1 year ago • • @dve 100% is the entire code base of the time. It has kept growing ever since before 2000.But that confusion risk is also why I won't keep this version of the graph, I will go with the "take 4" I posted later. @Daniel Vergien Languages Search Text Share via ...

Étienne Parmentier
in reply to daniel:// stenberg:// • • •daniel:// stenberg://
in reply to Étienne Parmentier • • •daniel:// stenberg://
in reply to daniel:// stenberg:// • • •𝚜𝚎𝚕𝚎𝚊
in reply to daniel:// stenberg:// • • •daniel:// stenberg://
in reply to 𝚜𝚎𝚕𝚎𝚊 • • •CgX
in reply to daniel:// stenberg:// • • •Is it possible to see the amount of code in absolute terms and not as a percentage? :)
#weirdRequests
daniel:// stenberg://
in reply to CgX • • •CgX
in reply to daniel:// stenberg:// • • •daniel:// stenberg://
in reply to CgX • • •CgX
in reply to daniel:// stenberg:// • • •Stephen Shankland
in reply to daniel:// stenberg:// • • •daniel:// stenberg://
in reply to Stephen Shankland • • •Stephen Shankland
in reply to daniel:// stenberg:// • • •daniel:// stenberg://
in reply to Stephen Shankland • • •daniel:// stenberg://
in reply to Stephen Shankland • • •daniel:// stenberg://
in reply to daniel:// stenberg:// • • •My scripts for this are of course available and open source and you can run them against your project easily.
Just needs perl, git, gnuplot - and patience.
github.com/curl/stats/blob/mas…
github.com/curl/stats/blob/mas…
stats/codeage.pl at master · curl/stats
GitHubQuentin Pradet
in reply to daniel:// stenberg:// • • •bkim
in reply to daniel:// stenberg:// • • •bkim
in reply to bkim • • •GitHub - src-d/hercules: Gaining advanced insights from Git repository history.
GitHubdaniel:// stenberg://
in reply to bkim • • •daniel:// stenberg://
Unknown parent • • •daniel:// stenberg://
Unknown parent • • •Daniel Vergien
in reply to daniel:// stenberg:// • • •daniel:// stenberg://
in reply to Daniel Vergien • • •@dve 100% is the entire code base of the time. It has kept growing ever since before 2000.
But that confusion risk is also why I won't keep this version of the graph, I will go with the "take 4" I posted later.