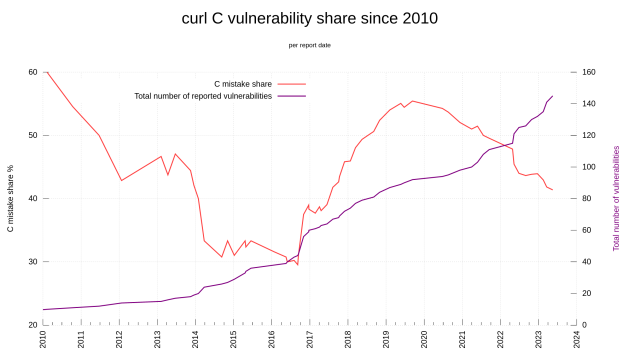
It's Friday so I made a new #curl graph. It shows the % share of the vulnerabilities that are "C mistakes" since 2010 - per the date of the findings being reported. The share was 60% of the reported flaws back in 2010, it went down, up and is coming down again and is now at 41.4%
This graph will appear in the regular dashboard starting tomorrow.

John Wyatt 🐧
in reply to daniel:// stenberg:// • • •looking through the changelog. 40% is still surprising considering the age of the software and many of the standards it implements.
Btw, thank you for making this graph and for your work on curl.