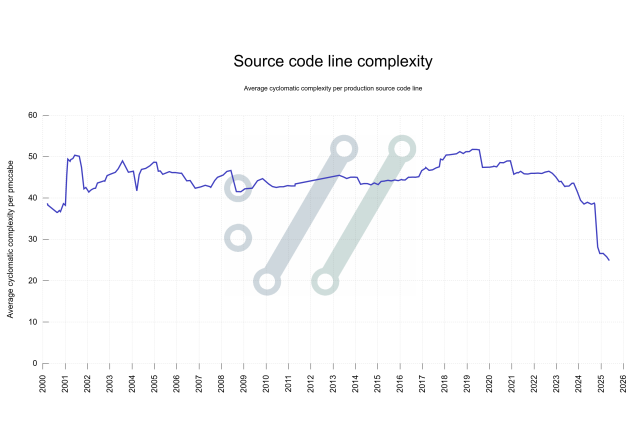
It's been a while but here's a new graph I'm testing. Getting the complexity for every function in #curl then assigning that complexity for all lines in that function. This gives an "average complexity per source code line".
Then plot this score for curl over time.
The idea now being to push it down hard.

Tom
in reply to daniel:// stenberg:// • • •daniel:// stenberg://
in reply to Tom • • •daniel:// stenberg://
in reply to daniel:// stenberg:// • • •Spider
in reply to daniel:// stenberg:// • • •daniel:// stenberg://
in reply to Spider • • •Spider
in reply to daniel:// stenberg:// • • •daniel:// stenberg://
in reply to Spider • • •Stefan Eissing
in reply to daniel:// stenberg:// • • •daniel:// stenberg://
in reply to Stefan Eissing • • •Aris Adamantiadis 💲Paid
in reply to daniel:// stenberg:// • • •daniel:// stenberg://
in reply to Aris Adamantiadis 💲Paid • • •@aris this latest one is simply iterating over all relevant git tags, then runs 'git show' on the proper files into the pmccabe tool and stores the output for every tag. Then I gnuplot the the graph itself. Part of my curl dashboard setup.
github.com/curl/stats/blob/mas…
github.com/curl/stats/blob/mas…
stats/complex-dist.pl at master · curl/stats
GitHubAris Adamantiadis 💲Paid
in reply to daniel:// stenberg:// • • •Jim Fuller
in reply to daniel:// stenberg:// • • •Richard Levitte
in reply to daniel:// stenberg:// • • •daniel:// stenberg://
in reply to Richard Levitte • • •quantitative measure of the number of linearly independent paths through a code
Contributors to Wikimedia projects (Wikimedia Foundation, Inc.)Richard Levitte
in reply to daniel:// stenberg:// • • •Stefan Eissing
in reply to daniel:// stenberg:// • • •When we do the right de-complications, the number will go down.
But it‘s refactoring on how things operate, not „just“ splitting up high-scoring functions into pieces.
Complexity, to me, is dominated by the amount of state functions operate on. Not the if/switch paths. When all functions have access to a couple hundred state variable, things remain very complex.
daniel:// stenberg://
in reply to Stefan Eissing • • •