@hughsie pmccabe for getting complexity/function size data, git for getting the files from various tags over time, perl to glue it all together and then finally I gnuplot everything into SVG images
@hughsie you'll see that I like generating a CSV file with the script that I then let gnuplot render the image from. It makes them two distinct steps that are easy to debug and work on separately.

kate
in reply to daniel:// stenberg:// • • •daniel:// stenberg://
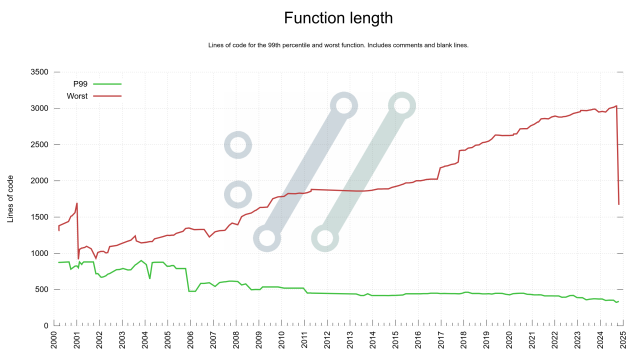
in reply to kate • • •@kate a function that has a big switch() for over 300 options for curl_easy_setopt().
But not anymore.
kate
in reply to daniel:// stenberg:// • • •daniel:// stenberg://
in reply to kate • • •daniel:// stenberg://
in reply to daniel:// stenberg:// • • •Richard Hughes
in reply to daniel:// stenberg:// • • •daniel:// stenberg://
in reply to Richard Hughes • • •daniel:// stenberg://
in reply to daniel:// stenberg:// • • •@hughsie the perl script: github.com/curl/stats/blob/mas…
the gnuplot scripts: github.com/curl/stats/blob/mas…
github.com/curl/stats/blob/mas…
stats/complexity.pl at master · curl/stats
GitHubRichard Hughes
in reply to daniel:// stenberg:// • • •daniel:// stenberg://
in reply to Richard Hughes • • •