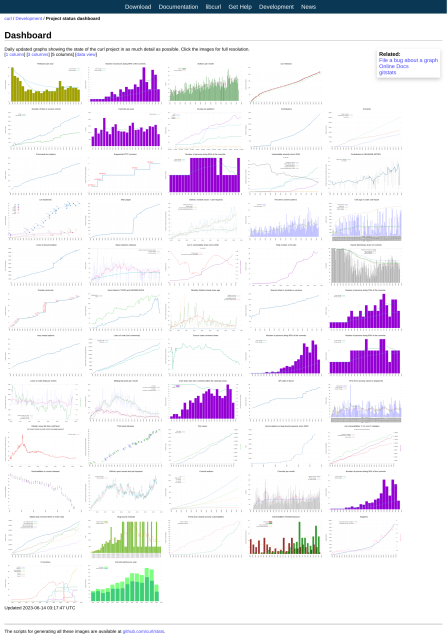
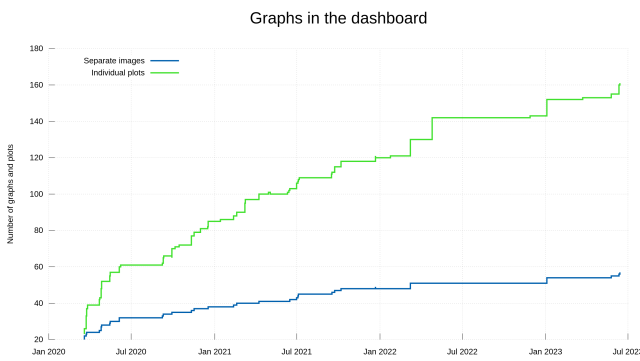
daniel:// stenberg:// 2 years ago • • daniel:// stenberg:// 2 years ago • • This graph shows number of graphs over time in the #curl dashboard...curl.se/dashboard.html curl - Project status dashboardcurl.se #curl This entry was edited (2 years ago) Languages Search Text Share via ...
in reply to daniel:// stenberg:// jeffluszcz in reply to daniel:// stenberg:// • 2 years ago • • omg, I love it! Need the # of Graphs in the Graphs in the dashboard graph now! Languages Search Text Share via ...
in reply to daniel:// stenberg:// NumeRe.org in reply to daniel:// stenberg:// • 2 years ago • • How meta 😉 Languages Search Text Share via ...
in reply to daniel:// stenberg:// Billy O'Neal in reply to daniel:// stenberg:// • 2 years ago • • xkcd.com/688/Self-Descriptionxkcd Search Text Share via ...
in reply to daniel:// stenberg:// Paolo Barbolini in reply to daniel:// stenberg:// • 2 years ago • • I'm thinking I should be doing something similar in Grafana. How high of a sample rate should I have 🤔 Languages Search Text Share via ...
in reply to Paolo Barbolini daniel:// stenberg:// in reply to Paolo Barbolini • 2 years ago • • @paolobarbolini the more graphs the merrier! @Paolo Barbolini Languages Search Text Share via ...

jeffluszcz
in reply to daniel:// stenberg:// • • •NumeRe.org
in reply to daniel:// stenberg:// • • •Billy O'Neal
in reply to daniel:// stenberg:// • • •Self-Description
xkcdPaolo Barbolini
in reply to daniel:// stenberg:// • • •daniel:// stenberg://
in reply to Paolo Barbolini • • •