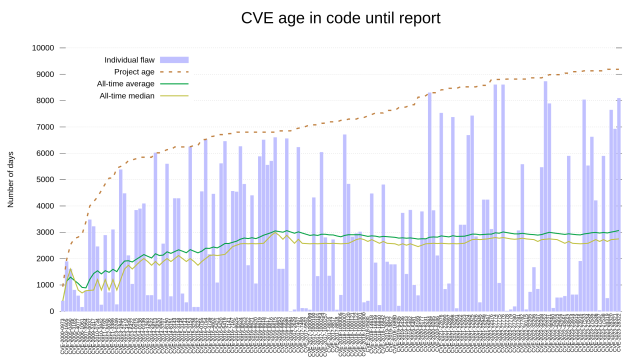
This #curl Friday graph is the "CVE age in code" one refurbished. I cleaned it up a little and added a median plot to it next to the average. Very similar!
The graph shows all 145 curl CVEs and the number of days each of them existing in shipped source code until fixed.

Jimmy Sjölund
in reply to daniel:// stenberg:// • • •daniel:// stenberg://
in reply to Jimmy Sjölund • • •Jimmy Sjölund
in reply to daniel:// stenberg:// • • •Lambda
in reply to daniel:// stenberg:// • • •daniel:// stenberg://
in reply to Lambda • • •daniel:// stenberg://
Unknown parent • • •