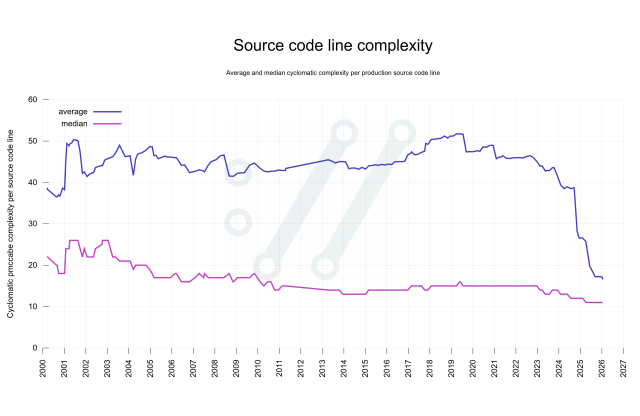
daniel:// stenberg:// 15 hours ago • • daniel:// stenberg:// 15 hours ago • • added a median plot to the average #curl source code complexity graph #curl Languages Search Text Share via ...
in reply to daniel:// stenberg:// Victor Julien in reply to daniel:// stenberg:// • 15 hours ago • • looks interesting, what tooling do you use to generate this? Languages Search Text Share via ...
in reply to Victor Julien daniel:// stenberg:// in reply to Victor Julien • 15 hours ago • • @inliniac git, perl, pmccabe and gnuplotgithub.com/curl/stats/blob/mas…github.com/curl/stats/blob/mas…stats/line-complex.pl at master · curl/statsScripts for generating project statistics and for plotting them as graphs. - curl/statsGitHub @Victor Julien Languages Search Text Share via ...
in reply to daniel:// stenberg:// Victor Julien in reply to daniel:// stenberg:// • 15 hours ago • • I'll check it out, thanks! Languages Search Text Share via ...
in reply to daniel:// stenberg:// Frank Gevaerts in reply to daniel:// stenberg:// • 14 hours ago • • But... Aren't lines supposed to go up? Languages Search Text Share via ...

Victor Julien
in reply to daniel:// stenberg:// • • •daniel:// stenberg://
in reply to Victor Julien • • •@inliniac git, perl, pmccabe and gnuplot
github.com/curl/stats/blob/mas…
github.com/curl/stats/blob/mas…
stats/line-complex.pl at master · curl/stats
GitHubVictor Julien
in reply to daniel:// stenberg:// • • •Frank Gevaerts
in reply to daniel:// stenberg:// • • •